How To Check Total Disk Space On Grafana Graph View From Zabbix Data2 min read
Now I want to share how to check total disk space using grafana visualization. And data source is ZABBIX server database add in grafana server. You can show many visualization like disk space, ram, cpu etc.
★ How To Install Docker Community Edition On Centos 7
★ How To Install And Configure Zabbix Plugin For Grafana Server
Step #01: Login to your Zabbix server for see latest data.
Goto Monitoring / Latest data then select your desired host for see latest data. Now see total disk space, free disk space and used disk space.
Step #02: Now login to grafana server for see real time data from zabbix server.
See this example below image
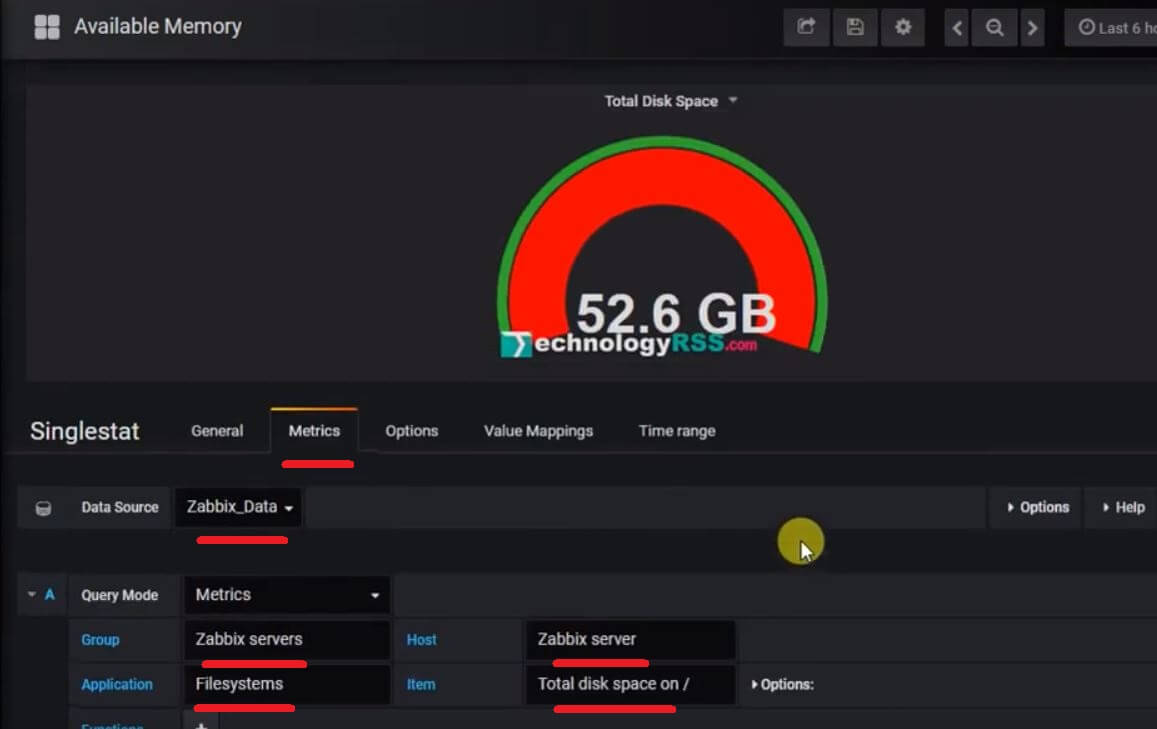
You can compare zabbix and grafana data same or different.
If you can’t add zabbix data into grafana so please see this tutorial How To Install And Configure Zabbix Plugin For Grafana Server.
If any problem please see my YouTube channel for more details.

I am system administrator as Windows and Linux platform. I have 4 years skilled from the professional period. I have to configure Linux based system such as an Asterisk VOIP system, Network monitoring tools (ZABBIX), Virtualization (XEN Server), Cloud computing (Apache CloudStack) etc. Now share my professional skill each interested person.
Thanks to all.
Thanks to all.
Latest posts by Admin (see all)
- How To Enable SSH On Debian 13 Server - September 13, 2025
- Is Debian 13 Server on VirtualBox the EASIEST Way to Get Started - September 11, 2025
- How To Install Zabbix Server 7.4 On Ubuntu 22.04 - September 10, 2025